2018 Flytedesk campus advertising evaluation
Flytedesk worked with several prominent national civic organizations (NCOs) and political campaigns to run campus advertising programs encouraging voter registration and turnout. Flytedesk then hired Bluelabs to conduct program evaluation. The below report was prepared by Bluelabs for Flytedesk and has been re-printed with permission.
OVERVIEW AND METHODOLOGY
In late 2018, BlueLabs partnered with Flytedesk to analyze the impact of Flytedesk’s advertising program on the 2018 midterm elections, including registration, turnout and political attitudes of college-age voters.
Our investigation suggests that Flytedesk’s program likely had some effect both on voter attitudes and behavior. However, we found a number of data challenges throughout this process that make the following conclusions more suggestive than definitive. At the end of this report, we discuss ways that we can turn them into more definitive answers through lessons we can carry into future research.
QUESTIONS FOR ANALYSIS
- DID STUDENTS RECALL SEEING POLITICAL ADS ON OR AROUND CAMPUS?
- DID POLITICAL ADS CHANGE ATTITUDES?
- DID POLITICAL ADS CHANGE BEHAVIOR?
SOURCES OF DATA
For this analysis, we used a variety of data sources - including surveys, voter file data, and metadata:
- BLUELABS SURVEYS. One national survey of college students living in designated zip codes through live calls and online. Final sample was confirmed on age and gender and matched back to the voter file (N=563).
- TARGETSMART VOTER FILE. Voter file of all voters currently and previously registered. Full 2018 vote history is available for 46 of 50 states. Full 2014 vote history is available for 36 of 50 states.
- FLYTEDESK ONLINE SURVEYS. Seven surveys commissioned by Vote.org, Everytown, and Beto for Texas. In total, Flytedesk surveyed 2,738 people in these surveys, not including the control survey.
- CAMPUS METADATA. Characteristics of each of the 123 target campuses and 122 match campuses, including geography, admission rate, enrollment size, and type of college.
METHODOLOGY
During the course of running this program in 2018, Flytedesk targeted a series of campuses with outreach. Each time a campus was targeted, Flytedesk chose a "match" campus that shared similar baseline characteristics so that outcomes and trends could be compared between campuses that received campaign advertising and campuses that did not.
For example, Flytedesk targeted Washington University in St. Louis and chose Duke University as its match campus. On school characteristics, they are comparable on admission rate, enrollment, and type of university.
Note: To define campus areas, BlueLabs used zip-level data provided by Flytedesk for each target and match campus area.
During the course of our engagement, Flytedesk’s targeting program expanded, to the point that they were campaigning in some campuses previously assigned as matches. In the analysis, we’ve removed these pairs to focus on true targeted vs. non-targeted campus areas.
In addition, we focused analysis on target and match campus areas located in states with both geography and 2014/2018 vote history data on file. This allowed us to unpack trends in the change in turnout and registration to understand whether a lift was present for targeted campuses.
Ultimately these changes took the total campus pairings down from 123 to 64 pairs. More details on the final selection process are available in the Appendix below.
TOP TAKEAWAYS
- The overwhelming majority of students recalled seeing at least one political ad in 2018. One-third recalled a Flytedesk ad on targeted campuses.
- Political ads on campus may increase political enthusiasm among students.
- Flytedesk’s targeting program may have had an impact on registration, although the sample is small.
- Increase in turnout between 2014 and 2018 was higher for students on targeted campuses compared to match campuses. Turnout was also higher on campuses with higher investment in advertising campaigns
AD RECALL & POLITICAL ENTHUSIASM
Bluelabs surveyed college students online between Oct. 16 and Nov. 3, 2018, and by phone between Oct. 16 and Oct. 30, 2018. Questions in the survey focused primarily on ad recall, recall by media channel, registration status, intention to vote, opinions on student turnout, and opinions on student partisanship.
In total, we surveyed 563 student respondents who were matched back to the voter file. Whenever registered zip code was linked to one of the studied campuses, we matched respondents to the corresponding target or match campus (N=446). In our final analysis, respondents were weighted to represent the target audience.
For this analysis, BlueLabs compiled results of self- reported ad recall from both the Flytedesk surveys and the BlueLabs surveys.
POLITICAL AD RECALL WAS HIGH AMONG COLLEGE STUDENTS, AND HIGHEST FOR TRADITIONAL MEDIA CHANNELS
In the BL survey, more than nine in ten (93%) of surveyed students recalled seeing at least one political ad on at least one of the tested media channels.
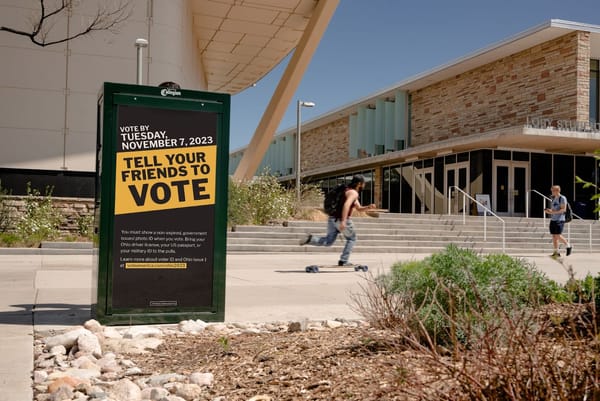
The majority of students recalled seeing a political ad on social media (86%), television (72%), and radio (52%), likely because the advertising volume was so high on these channels in 2018. Recall on Flytedesk-specific channels varied. For print media, 63% of students recalled seeing posters, 54% recalled seeing signage on campus, 37% recalled seeing an ad in the physical student newspaper, and 23% recalled seeing a branded coaster. 39% of students recalled seeing an ad in the digital school newspaper.

STUDENTS IN TARGETED AREAS RECALLED ADS AT SLIGHTLY HIGHER RATES, AND LIFT FOR AD RECALL WAS HIGHEST ON FLYTEDESK CHANNELS.
Compared to the traditional media channels used by other media vendors, Flytedesk-specific channels, such as signage on campus, student newspapers, and branded coasters, had the highest lift in ad recall when comparing target and match campuses. Radio, another media channel used by Flytedesk, also saw a higher lift of 7%, but since it is used heavily by other political media vendors, it’s harder to isolate Flytedesk’s effect.

OVERALL, STUDENTS FELT MORE POSITIVE ABOUT POLITICAL ADS ON CAMPUS OR IN NEWSPAPERS.
In the Flytedesk surveys, students were most positive about political advertising on or around campus, with 37% of students reporting they liked or loved it. Channels where students felt more negative about ads included the big three - social media, radio and television - with more than one-quarter reporting they did not like or hated political ads on them.

STUDENTS IN TARGETED AREAS WERE MORE ENTHUSIASTIC ABOUT VOTING IN THE MIDTERMS. ADDITIONALLY, THEY WERE SLIGHTLY MORE ENTHUSIASTIC ABOUT STUDENT TURNOUT ON CAMPUS.
At the time of the survey, students from target campuses were 6% more likely to report their intention to vote in the 2018 midterms compared to respondents from match campuses. Students from target campuses were also more likely to believe that almost all students would vote in the 2018 midterms (16%) compared to students on match campuses (12%).

WE ALSO FOUND A RELATIONSHIP BETWEEN RECALL OF AD CONTENT AND TOP ISSUES OF IMPORTANCE.
Notably, students who recalled seeing an Everytown for Gun Safety ad were also more likely to report gun control as one of their top issues compared to those who recalled other ads (Beto or Vote.org). In fact, gun control was the most frequent response among Everytown recall-ers compared to the other issues, with more than half (55%) reporting it as being in their top three issues.

Key takeaways
- Students on targeted campuses were more likely to report their intention to vote in the midterms compared to students on match campuses.
- Targeted students were slightly more likely to be enthusiastic about student turnout compared to students on match campuses.
- There appears to be some relationship between ad content recall and political issues, though the causal arrow could point in either direction.
AD TARGETING & POLITICAL BEHAVIOR
To assess Flytedesk’s impact on registration and turnout, BlueLabs compared a snapshot of individual-level turnout in 2018 and 2014 between target and match campuses. Due to data challenges listed earlier in the report, we used 64 of the 123 target-match campus pairs for final analysis (please see slide 8 and the Appendix for greater detail). Additionally, we restricted the analysis to college-age voters, defined as those 25 or under living on primary campus zips, and those 22 or under living on off-campus zips.
HIGH TURNOUT AMONG YOUNG VOTERS IN 2018 HAS BEEN A KEY FINDING IN RESEARCH. WE EXPECTED SIMILAR TRENDS IN OUR ANALYSIS.
A few research institutions, including Pew Research Center and Tuft University’s Center for Information and Research on Civic Learning for Engagement (CIRCLE), recently explored young voter turnout for 2018, and all point to higher youth turnout during the midterms. We expect to see similar trends in our analysis.
- MILLENNIALS, GEN X AND Z OUTNUMBERED BABY BOOMERS IN 2018. For the first time, the three youngest generations outnumbered Baby Boomer voters by total number of votes.
- ESTIMATES INDICATE YOUTH TURNOUT WAS BETWEEN 30 AND 42%. Pew found that turnout for Gen Z and Millennials ranged between 30% (Gen Z voters) and 42% (Millennial voters), and CIRCLE found that turnout among voters under 30 exceeded 30%.
- MILLENNIAL TURNOUT IN 2018 DOUBLED 2014. Pew reported that Millennials saw the greatest change in turnout, from 22% in 2014 to 42% in 2018.
BUT DATA CHALLENGES MAKE IT DIFFICULT TO COME TO DEFINITIVE CONCLUSIONS ABOUT FLYTEDESK’S IMPACT ON THESE TRENDS.
Shortcomings in the available data made it hard to state whether there was a causal relationship between Flytedesk’s targeting and registration & turnout:
- STUDENTS VS. YOUNG ADULTS. Our analysis cannot control for student status, so there are young adults included in the analysis that are not students at their corresponding campus.
- REGISTERED ADDRESS. On that note, we are also restricted to using registration address information on file. That means we are unable to capture students on campuses that are registered elsewhere.
- COMPARISONS ACROSS STATES. Last, in the final selection of target and match campuses, we found that 40 pairs were not located in the same state. This limits our ability to come to any definitive conclusions since matching to campuses in different states introduces new biases in the data, including differences between states and state races.
Despite these challenges, we found similar trends that cut across our data sources and suggest a potential relationship between Flytedesk’s targeting program and impact on turnout.
OVERALL, REGISTRATION WAS NOT HIGHER ON FLYTEDESK’S TARGETED CAMPUSES, BUT VOTER TURNOUT WAS.
Target campuses did not experience a lift in registration compared to match campuses. The average difference in change in registration (2014 vs. 2018) between target and match campuses was close to 0%. Analyzing just where voter registration campaigns ran, we see that the targeted campuses had a slightly higher change in registration on average. However, due to the small number of schools used in this analysis, our findings are more suggestive of a positive relationship, and we are unable to estimate the exact impact.
Voter file analysis indicated that the change in turnout rate was 2 percentage points higher for target campuses compared to match campuses. In addition to available findings from the voter file, we saw a similar trend among respondents from the BlueLabs survey. Respondents from target campuses were 3% more likely to turn out and vote compared to respondents from match campuses.
POLITICAL BEHAVIOR TAKEAWAYS
- Flytedesk’s targeting program may have had an impact on registration on campuses where voter registration campaigns ran, although the sample is small.
- Our findings suggest that Flytedesk’s GOTV campaigns led to a higher increase in turnout than what would have otherwise happened. We see this trend in both our voter file and survey analysis.
LESSONS LEARNED
While our findings suggest positive relationships between campus targeting and ad recall, political enthusiasm, and political behavior of college students, some shortcomings in the data make it difficult to reach definitive conclusions.
For that reason, we recommend that Flytedesk continue with research to arrive at more concrete conclusions. Some suggestions we have to develop a more robust analytics program are below
FIRST, CHOOSE TARGET AND MATCH CAMPUSES IN THE SAME STATE AND ELECTORAL RACE.
There are several state-specific factors that are hard to control generally in analysis, including large demographic differences and differences in voter registration, early voting, and absentee voting.
Furthermore, cases where the political races differed substantially between target and match schools presents a challenge to this analysis. For example, many Texas schools targeted for Beto’s campaign were matched against a school in another state, where the statewide race may not have had as popular a candidate or as much media attention.
Restricting to the same state and race will help remove these kinds of biases from future analysis.
SECOND, KEEP TARGET AND MATCH CAMPUSES CONSISTENT DURING COURSE OF STUDY.
During the 2018 midterms, Flytedesk expanded its program so much that there were a handful of campuses originally marked as match campuses that became targeted campuses.
This was an exciting and important development in the programming, but it led to some analytical challenges. Whenever possible, we recommend selecting match campuses that are less likely to solicit Flytedesk’s services for on-campus targeting during the course of the ongoing election.
ADDENDUM: ANALYSIS ON AMOUNT OF SPEND AND OVERALL IMPACT
Students on campuses where there was greater spend in Flytedesk campaigns recalled ads at higher rates, especially on media channels used by Flytedesk.
Impact on turnout appears to increase with greater spending up to the highest amounts spent by Flytedesk in 2018, though marginal return on investment declines steadily as spending increases.
When we analyzed ad recall among survey respondents from the BlueLabs survey, we found that recall was generally high. However, the observed lift in recall was evident for students on campuses with greater spend on Flytedesk advertising compared to their match campuses.
THE LIFT IN AD RECALL OCCURRED ON CAMPUSES WHERE INVESTMENT IN FLYTEDESK ADVERTISING WAS HIGHER.
Across the Flytedesk surveys, students were most likely to report seeing a Beto for Texas advertisement on campus, where average cost of spending was highest compared to other advertising campaigns.

Recall was higher on campuses where Flytedesk advertising costs exceeded $2,000 compared to campuses where costs stayed below $2,000.

RECALL BY MEDIA CHANNEL WAS ALSO HIGHER ON CAMPUSES WHERE INVESTMENT WAS HIGHER
Recall was higher on the Flytedesk media channels for campuses where spend was greater than $2,000.

THERE WAS HIGHER LIFT IN TURNOUT ON CAMPUSES WHERE MORE MONEY WAS SPENT.

APPENDIX: FINAL CAMPUS SELECTION PROCESS.
The checklist below illustrates our checks to create the final set of campuses. *Note that zips overlapped between target and match campuses for roughly 1% of the final universe.

Prior to conducting analysis, we checked the demographic breakdowns for the final list of target and match campuses to confirm comparability to one another. Among registered voters, most of the general demographics were consistent, though regions varied:

We also checked to see how comparable target and match campuses were in an earlier election year, 2014, to confirm that there were no major changes leading up to 2018 that would bias our results. Of the general demographics available on 2014 registered voters, target and match campuses looked comparable on race and sex, with the same regional differences we see in 2018.

